Publish the evidence trail
A source label that says only “match data” is not enough. Identify the provider or dataset, competition coverage, relevant season or date range and the version used. Explain the unit of observation and the exclusions that could change interpretation. A reader should be able to distinguish a complete competition record from a selective sample without reverse-engineering the graphic.
Link to the source and its documentation where licensing permits. The StatsBomb Open Data repository is an example of a source whose accompanying documentation and terms deserve attention alongside the data files. Publicly accessible does not mean unrestricted. Read the applicable license before redistributing records, publishing a download or using a provider's branding.
Distinguish observation from estimation
A recorded attempt and an expected-goals value are different kinds of evidence. The first describes an event according to a collection process. The second summarizes a model's estimate given selected information. Both can be useful, and both have limitations. Do not let a shared decimal format imply that they have the same evidential status.
Missing observations, uncertain locations and model assumptions should be described specifically. “Data may be imperfect” is too broad to help. Explain whether the problem could affect the ordering, magnitude or completeness of the displayed comparison. If you cannot quantify an uncertainty responsibly, say what is unknown and narrow the conclusion rather than manufacturing a precise-looking range.
Source
Who recorded the evidence, under which definitions and with what reuse conditions?
Transformation
Which filters, calculations and model choices sit between the original record and the graphic?
Interpretation
What can the reader reasonably conclude, and where does the evidence stop?
Make meaning available in more than one form
The Web Content Accessibility Guidelines 2.2, published by W3C, provide a practical framework for accessible delivery. Use meaningful headings, native controls, visible focus and sufficient contrast. Do not distinguish teams only by color: add direct labels, shapes, patterns or another redundant cue. Accessibility should influence the first design sketch, not arrive as a final compliance layer.
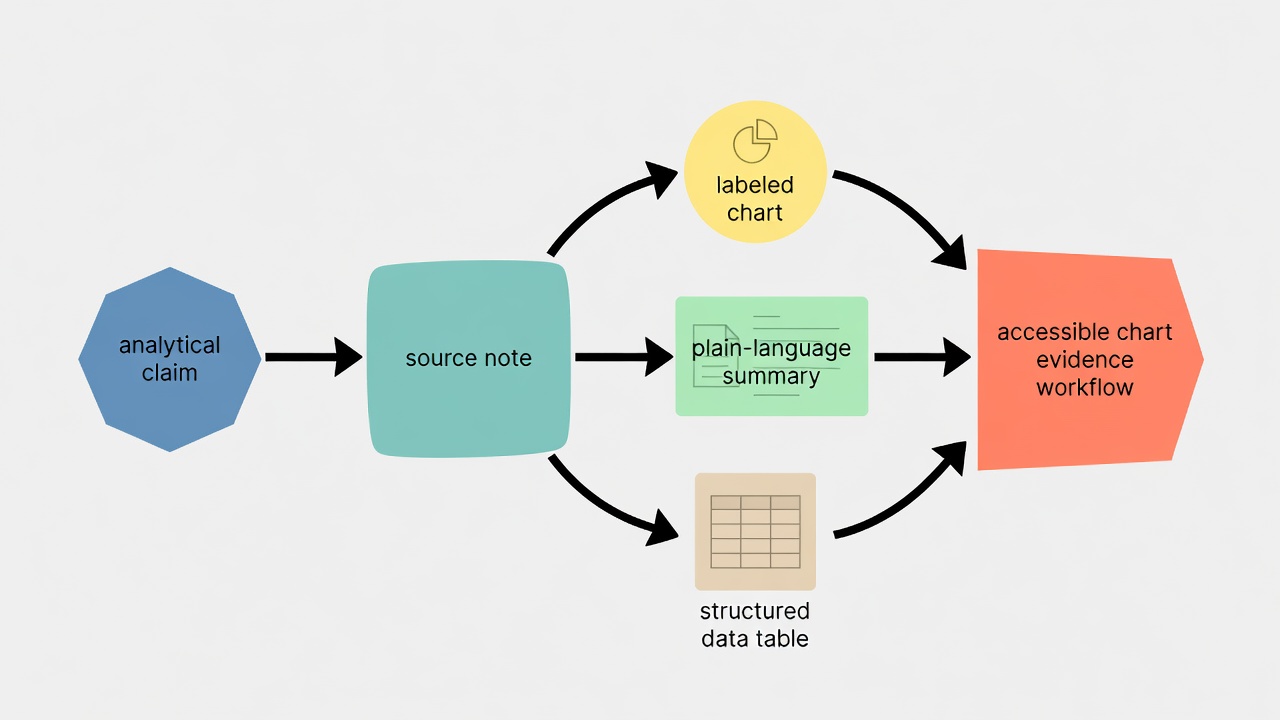
An image alternative should describe the purpose of the image in context. For a complex chart, a concise alt description can identify the subject while a nearby summary and structured table carry the detail. Avoid filling an alt attribute with every value when a well-formed table would be easier to navigate. Equally, do not write “chart” and leave the actual finding inaccessible.
Tables need captions and correctly associated headers. Preserve meaningful numerical precision and explain abbreviations. Place wide tables inside horizontally scrollable containers so the whole page does not overflow on a phone. A table is a complementary way to inspect values; a plain-language summary still helps readers understand why those values matter.
Test the delivered experience
Automated checks can find some implementation problems, but they cannot determine whether a sports explanation is understandable. The axe-core project and browser developer tools can assist with technical inspection. NVDA and VoiceOver can help reveal how reading order, labels and updates are presented through screen readers. Tests should be conducted by people familiar with the tools and, where possible, by readers who use them routinely.
Check keyboard-only use, zoomed layouts and reduced motion. Confirm that a filter update is announced when necessary without repeatedly interrupting the reader. Inspect the design in monochrome and at narrow widths. A chart can pass a contrast check yet remain difficult to interpret because its labels are tiny, its legend is remote or its selected state is ambiguous.
Keep revisions visible
Data may be corrected after publication, and explanations may need to change with it. Keep a revision record that states what changed and whether the conclusion changed. Retain enough internal version history to reconstruct the published result. Git can help track code and text; a DOI through a repository such as Zenodo can help identify a stable research artifact when appropriate.
The W3C PROV family offers a formal way to think about provenance relationships between entities, activities and agents. Not every editorial project needs a formal provenance graph. Every project does need a recoverable account of where its evidence came from and what happened to it. Choose the lightest process that reliably preserves that account.
Review the claim as carefully as the code
Before publication, ask another person to read the headline against the data and definitions. Check whether the caveat is near enough to the relevant claim to be noticed. Review the work of the UK Statistics Authority and the Office for Statistics Regulation for broader principles of trustworthy statistical communication, while remembering that an independent sports graphic is not thereby an official statistic.
Trust is not created by attaching a collection of institutional names to a footer. It comes from decisions a reader can inspect: an honest denominator, a usable alternative, a documented revision and a conclusion no stronger than the evidence. Make those decisions visible, and the graphic becomes easier to question in exactly the way good analysis should allow.