Match the form to the task
A reader comparing two totals benefits from a different structure than a reader locating attempts around a penalty area. For magnitude, aligned positions and lengths make differences relatively easy to inspect. For location, a pitch preserves relationships that an aggregate bar removes. For change, a sequence can show when a pattern developed. Begin with that task, then select a form.
William Cleveland and Robert McGill's work on graphical perception remains a useful reference for why common scales support precise judgments. Edward Tufte's writing encourages close attention to evidence and unnecessary decoration, while Jacques Bertin's visual variables offer a vocabulary for position, size, shape and value. None is a template to apply mechanically; each helps explain why a particular encoding serves a particular comparison.
Give the denominator equal billing
A total rewards volume. A rate describes a relationship to opportunity. Neither is automatically the fairer measure. A team with six shots on target from twelve attempts has a larger on-target total than a team with four from five, but a lower on-target share. A chart that hides the denominator makes those different questions look interchangeable.
Per-90-minute rates can support comparisons between players with unequal minutes, but they do not erase role, competition strength or sample size. Per-possession rates answer another question again. State the denominator in the title or subtitle, retain the raw count nearby and avoid rankings that let a tiny exposure dominate without explanation.
Before and after: attach the question
The first panel offers a volume comparison with minimal framing. The second adds a defined measure and a selectable denominator. The improvement is not richer decoration: it is making the analytical choice inspectable. Both fictional teams and all values below are illustrative.
Before: isolated total
Shots on target; scale 0–10. Attempts are absent from this view.
North: 6. South: 4. This answers only a volume question.
After: explicit comparison
Shots on target; scale 0–10.
Shots on target: North 6; South 4. North leads on total volume.
| Team | Attempts | On target | On-target share |
|---|---|---|---|
| North | 12 | 6 | 50% |
| South | 5 | 4 | 80% |
Let spatial marks remain spatial
A shot map should make attacking direction explicit and use a documented coordinate system. If circles encode chance estimates, map value to area rather than radius, and include a size key. Otherwise the largest marks can exaggerate differences. Avoid placing decorative pitch textures behind low-contrast events; the geography should support the marks rather than compete with them.
Density surfaces introduce an additional choice: smoothing. A broad kernel can imply continuous territorial occupation between sparse events, while a narrow one may produce unstable hotspots. Explain the method and show the underlying sample when practical. A dense patch records where selected events occurred; it does not automatically establish control or tactical intention.
Use small multiples to protect context
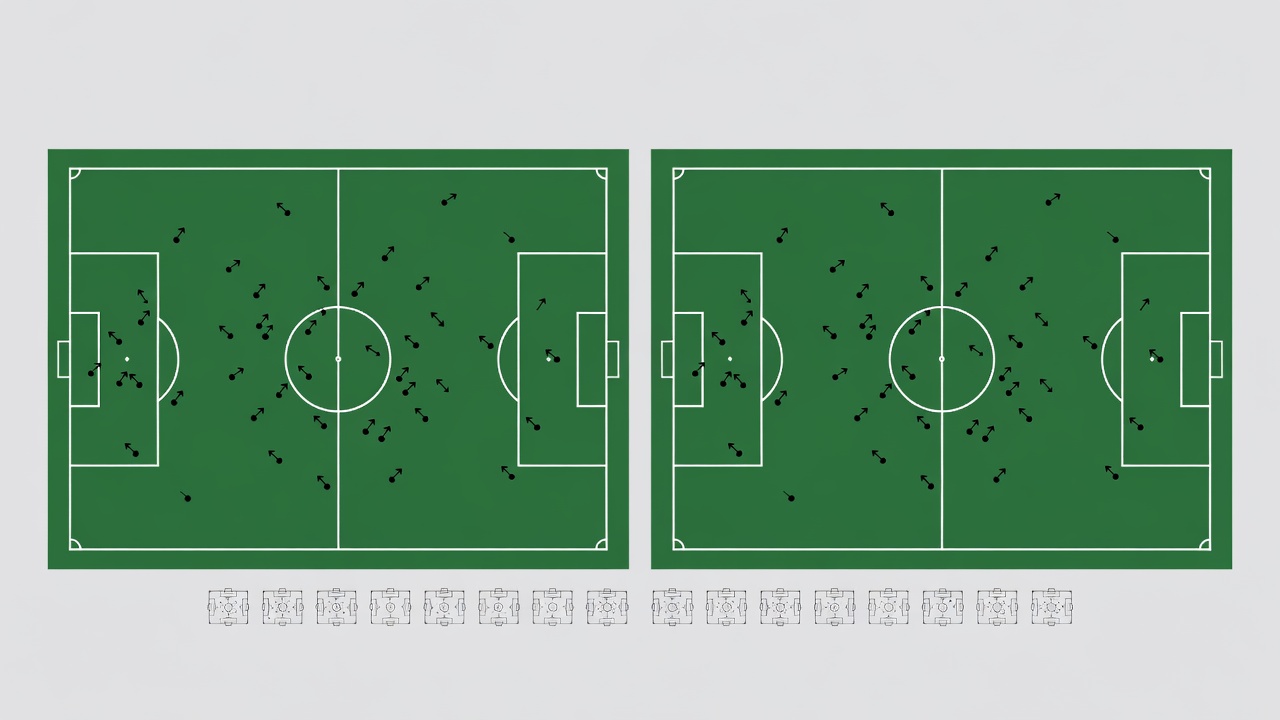
Separate panels can compare halves, players or match phases without layering every observation into one tangled image. Keep axes, pitch orientation and symbol rules consistent. If one panel changes scale, label that change conspicuously. A set of individually attractive charts can still mislead when their scales silently reset.
D3, Observable Plot and Vega-Lite can all support carefully specified visual encodings. Matplotlib and ggplot2 can produce strong static explanations. Tool choice should follow the publishing context, expected interaction and maintenance capacity. A library cannot decide whether a comparison is fair, and elaborate implementation is not evidence of analytical rigor.
Annotate the point without closing the debate
A useful annotation names a visible feature and explains its relevance. It does not smuggle a stronger claim into a confident headline. Write “more recorded attempts after the interval” when that is what the data supports, rather than “the tactical change transformed the match.” Keep observations and interpretations distinguishable in wording and placement.
Finally, inspect the chart at its actual reading size. Check labels, numerical precision, baseline behavior and the order in which a reader encounters the evidence. Remove any flourish that makes values harder to compare. The best geometry is the one that lets a reader notice both the pattern and its limits.