Write the question before the query
Start with a sentence a reader could reasonably ask: did the team generate more attempts after half-time, or did its attempts simply come from different locations? These are related questions, but they require different evidence. The first needs a time comparison. The second needs spatial context. A single dramatic number can obscure that distinction, especially when the score changed and the opponent altered its approach.
Specify the audience and decision alongside the question. A performance analyst may need possession-level inspection; an editor may need a compact explanation for a general audience. A commissioner should ask what the reader must understand after thirty seconds, not how many visual components the page can contain. That brief becomes a test for every later transformation.
Read the provider's definitions
StatsBomb Open Data and the public materials published by Opta are useful starting points for understanding event vocabularies. Their categories should not be assumed interchangeable. A pressure, recovery, assist or blocked attempt can depend on a provider's collection rules. Read the relevant documentation before merging seasons, competitions or sources. Record the definitions that matter to your particular argument.
Match laws and data schemas answer different questions. The IFAB Laws of the Game describe the rules of football; they do not supply a universal taxonomy for every analytical event. Likewise, FIFA and UEFA publish competition information, but an official result alone cannot validate every event location or modeled chance value in a separate dataset.
Keep a source ledger
Record the file, provider, retrieval date, coverage, license and transformations. Keep the untouched source separate from your working copy.
Check the unit of observation
A row might represent an event, a possession, a player appearance or a tracking frame. Counting rows without establishing that unit is a reliable way to create an impressive but meaningless total. Inspect identifiers, duplicate records, missing players and period boundaries. A repeated event identifier may be an ingestion error, while multiple rows with the same timestamp may be entirely legitimate.
Time deserves particular care. Some feeds express each period from zero; others use a continuous match clock. Added time and extra time can make a naive minute conversion misleading. Preserve the original clock fields and document your display rule. Spatial coordinates need the same discipline: note the origin, scale, attacking direction and whether positions have been normalized between halves.
Transform with an audit trail
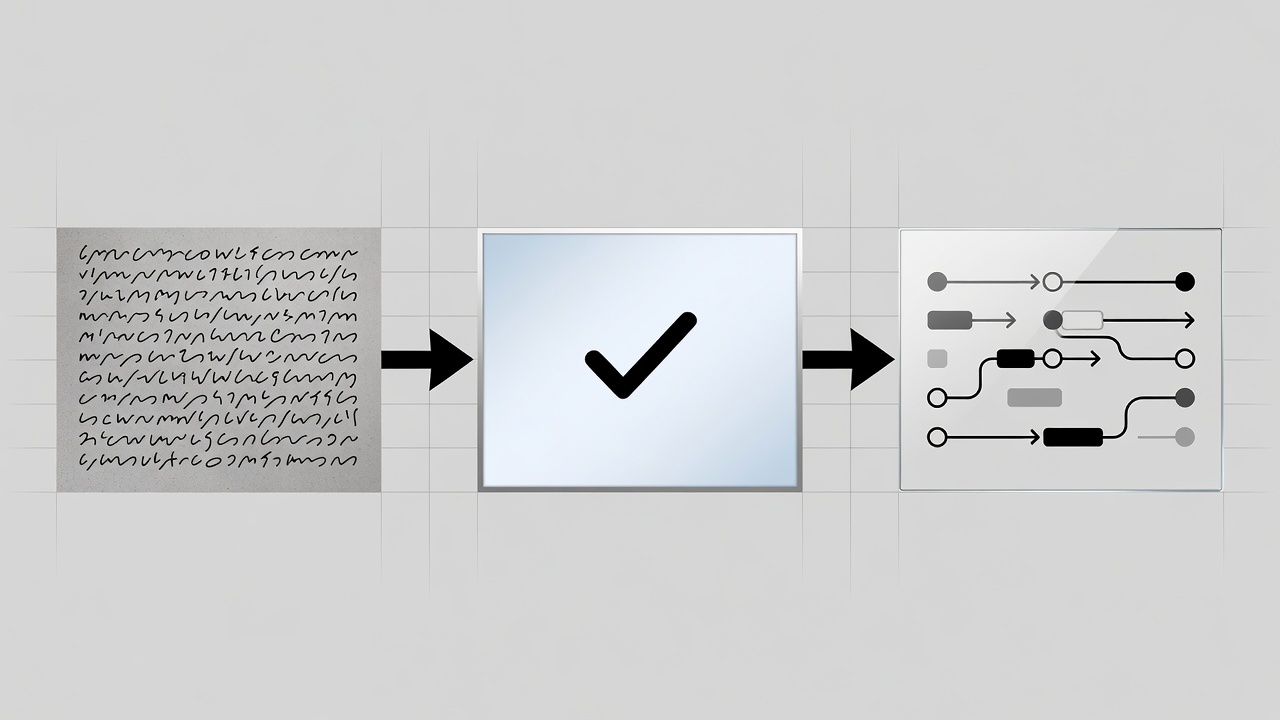
SQL can make grouping and exclusions explicit. Python with pandas or R with dplyr can produce reproducible checks and summaries. These tools do not confer correctness automatically; their value is that another analyst can inspect the steps. Name intermediate outputs clearly, test expected ranges and reconcile summary totals with the source before composing the visual.
The socceraction project and its SPADL representation illustrate why a common action format can help comparison. Standardization still involves choices. If a conversion discards qualifiers or combines categories, preserve a note describing that loss. A convenient common schema should not imply that the underlying collection methods have become identical.
Separate description from explanation
Suppose a team records more attempts after a substitution. You can describe the timing and distribution. You cannot establish the substitution as the cause from that sequence alone. Score state, fatigue, tactical changes and opponent behavior may all matter. State the observed pattern first, then distinguish a plausible interpretation from a tested causal claim.
Expected goals adds another layer. It is a model estimate conditional on its inputs and training choices, not a measurement of what “should” have happened with certainty. Do not mix values from different models without explaining the consequences. Where uncertainty cannot be quantified responsibly, describe its source plainly rather than inventing an interval that looks authoritative.
Hand over a defensible story package
A publishable handover should include the analytical question, checked data, transformation notes, metric definitions and proposed caveats. Add the reader-facing title and a sentence that describes what the evidence does not show. This package lets design and editorial colleagues challenge the claim before visual polish makes it harder to reconsider.
The final test is simple: can someone follow a displayed value back to a defined calculation and a known source? If not, the story is not ready for an elaborate interface. Resolve the break in that chain first. A modest chart with a recoverable evidence trail is more useful than a sophisticated scene whose numbers cannot be explained.